

Marketing metrics leadership understands: CAC, pipeline and payback on one page
Swap likes and lead volume for five metrics finance already uses, learn where each number comes from and which one to bring when your tools disagree.

The marketing metrics leadership understands are the ones finance already uses to judge any investment: the cost of winning a customer (CAC), the sales pipeline marketing generated, the conversion between funnel stages, the time it takes to earn the investment back (payback) and the value a customer brings over the relationship (LTV). Likes, reach and lead volume still matter, but they belong in the team's report.
Why channel metrics don't convince leadership
Leadership compares marketing with every other place the company's money could go. In Gartner's annual survey of 401 marketing leaders, almost all of them at large companies in North America and Europe, marketing budgets stayed practically flat: 7.8% of revenue in 2026, against 7.7% in 2025. In the same survey, 56% said they lacked the budget to deliver the year's strategy. This is the conversation happening right now, during marketing planning for 2027, when every department defends its own budget.
With a tight budget, click-through rate and cost per thousand impressions don't answer the question of whoever approves the spend. Compare them with numbers like the ones in our case studies: at Mercafacil, 30% of new revenue in 2025 came from the marketing we do together; at Franq, 40% of acquisition comes from our joint work. Any executive understands those sentences without asking for an explanation.
Five marketing metrics leadership understands
Five numbers are enough to show what marketing costs, what it brings in and how fast the money comes back.
| Metric | The question it answers | How to calculate it |
|---|---|---|
| CAC | What does it cost to win a customer? | marketing and sales investment in the period ÷ new customers in the period |
| Pipeline generated | How much did marketing put on the sales team's table? | total value of opportunities opened from marketing leads |
| Stage conversion | Where does the funnel lose people? | leads that moved to the next stage ÷ leads that entered the stage |
| Payback | How long until a customer pays back what they cost? | CAC ÷ (monthly revenue per customer × margin) |
| LTV | How much does a customer bring over the relationship? | monthly revenue per customer × margin × average months as a customer |
Three precautions prevent arguments in the meeting:
- Fully loaded CAC: include media, tools, agency fees and the share of the teams dedicated to acquisition. A media-only CAC looks smaller and loses finance's trust at the first question.
- Pipeline with a source rule: agree with sales on when an opportunity counts as marketing-generated, and keep the rule from one month to the next.
- LTV and CAC together: a high CAC is worth it when the customer stays for years. This pair shows whether growth pays for itself.
Where each number comes from
Each metric is born in a different source, and the page only adds up when all three talk to each other.
- Media and marketing tools: investment per campaign, leads and cost per lead.
- CRM: opportunities, pipeline value, closed deals and the move from one stage to the next.
- Finance: revenue per customer, margin, churn and average customer lifetime.
Stage conversion comes from the CRM and teaches the most, because it shows where leads leak between marketing and the signed contract. For payback and LTV, ask finance for the data and use the same numbers they use in their own meetings. A margin figure calculated by marketing turns into a debate, and the meeting time is gone.
When the ad platform and the CRM don't match, which number to bring
Bring the CRM number and say where it comes from. Different tools count leads in different ways. In a campaign we run with Franq, over the same period and with the same investment, RD Station counted 67 to 71 leads, and Meta's ads manager counted 62. That alone moved the cost per lead from R$27.60 to R$29.83, depending on the source.
Neither one was wrong. Each platform has its own attribution and counting rules, and the gap is normal. The problem starts when each report uses a different source and the number changes from month to month with no explanation. The practical rule:
- for leadership, the CRM, which is where sales works the leads;
- for campaign optimization, the platform number, which is what the algorithm sees;
- the same choice every month, written in the page footer.
Anyone tracking cost per lead by campaign knows the comparison only holds with the same yardstick end to end.
One page a month
The leadership report fits on one page, and everything else goes in the appendix. The format that works:
- the five metrics, compared with the previous month and with the target;
- one line of interpretation for each number that changed;
- one decision made during the month and one that needs approval.
Channel detail, such as the paid media report, still exists for the team and for anyone who wants to dig in. For someone who has just taken over a marketing team, agreeing on this page is one of the first commitments with leadership, as we show in the roadmap for the first 100 days of a marketing manager.
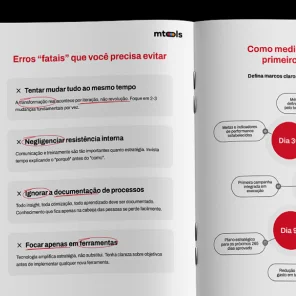 Support material · Whitepaper in PortugueseThe first 100 days as a marketing managerA roadmap from diagnosis to the first campaign, with the metrics the board understands.Download the whitepaper
Building this page once takes work; updating it by hand every month takes more. A dashboard that pulls together media, CRM and finance takes that weight off the team, and that is what we do in our data and dashboards service.
 Talk to usWant help planning this at your company?Tell us what you need. We'll reply by email or WhatsApp and, if it makes sense, put together a quote.Contact us
Frequently asked questions
Which marketing metrics should I bring to leadership?
CAC, pipeline generated, stage conversion, payback and LTV. If the company does not have revenue-per-customer data yet, start with the first three and add payback and LTV once finance can provide margin and customer lifetime.
What is the difference between marketing ROI and CAC?
ROI compares return with investment over a period or for a campaign. CAC shows how much each new customer cost. They complement each other: ROI speaks to a single initiative, while CAC, together with LTV, speaks to the health of growth.
How do I calculate CAC payback?
Divide CAC by one customer's monthly revenue multiplied by the margin. The result is the number of months it takes a customer to return what it cost to win them.